
The 3D Graph as Company Brain: What Obsidian Can Become
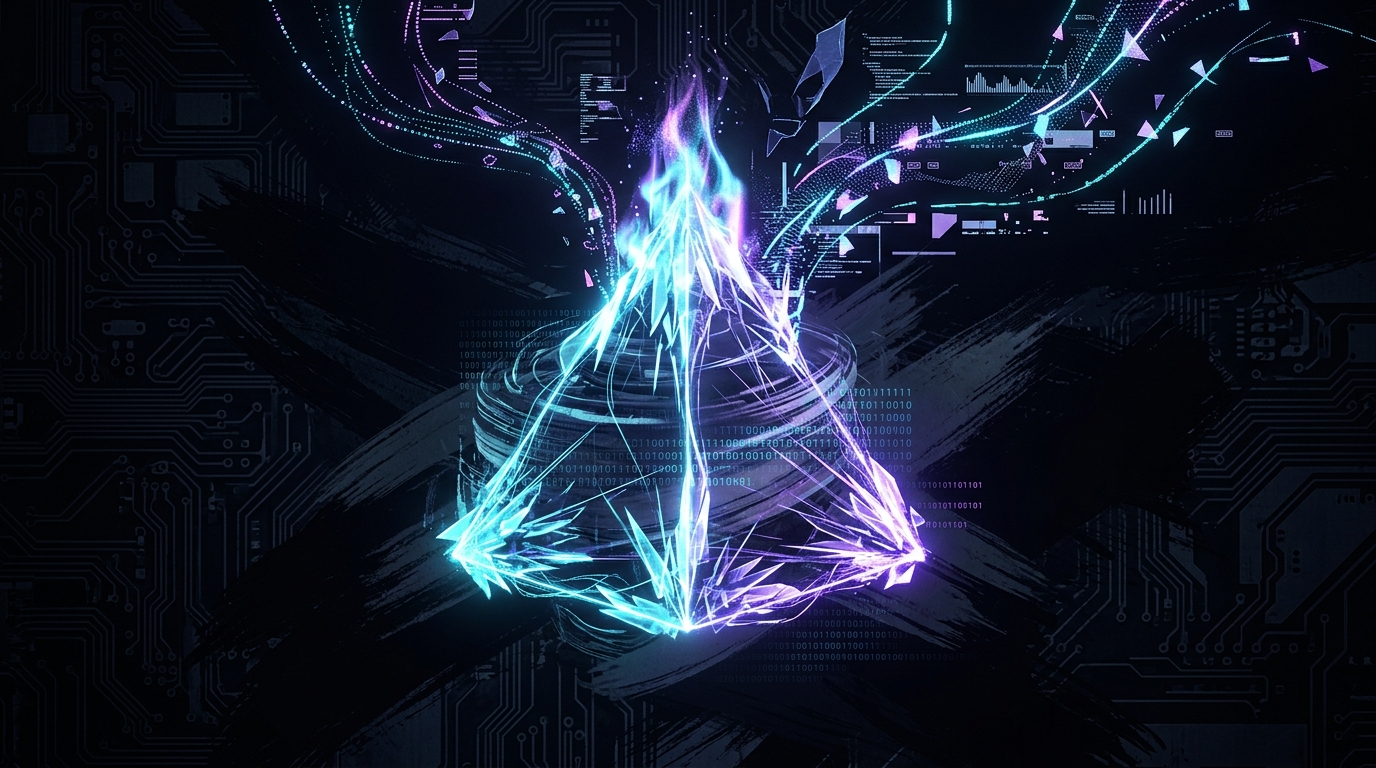
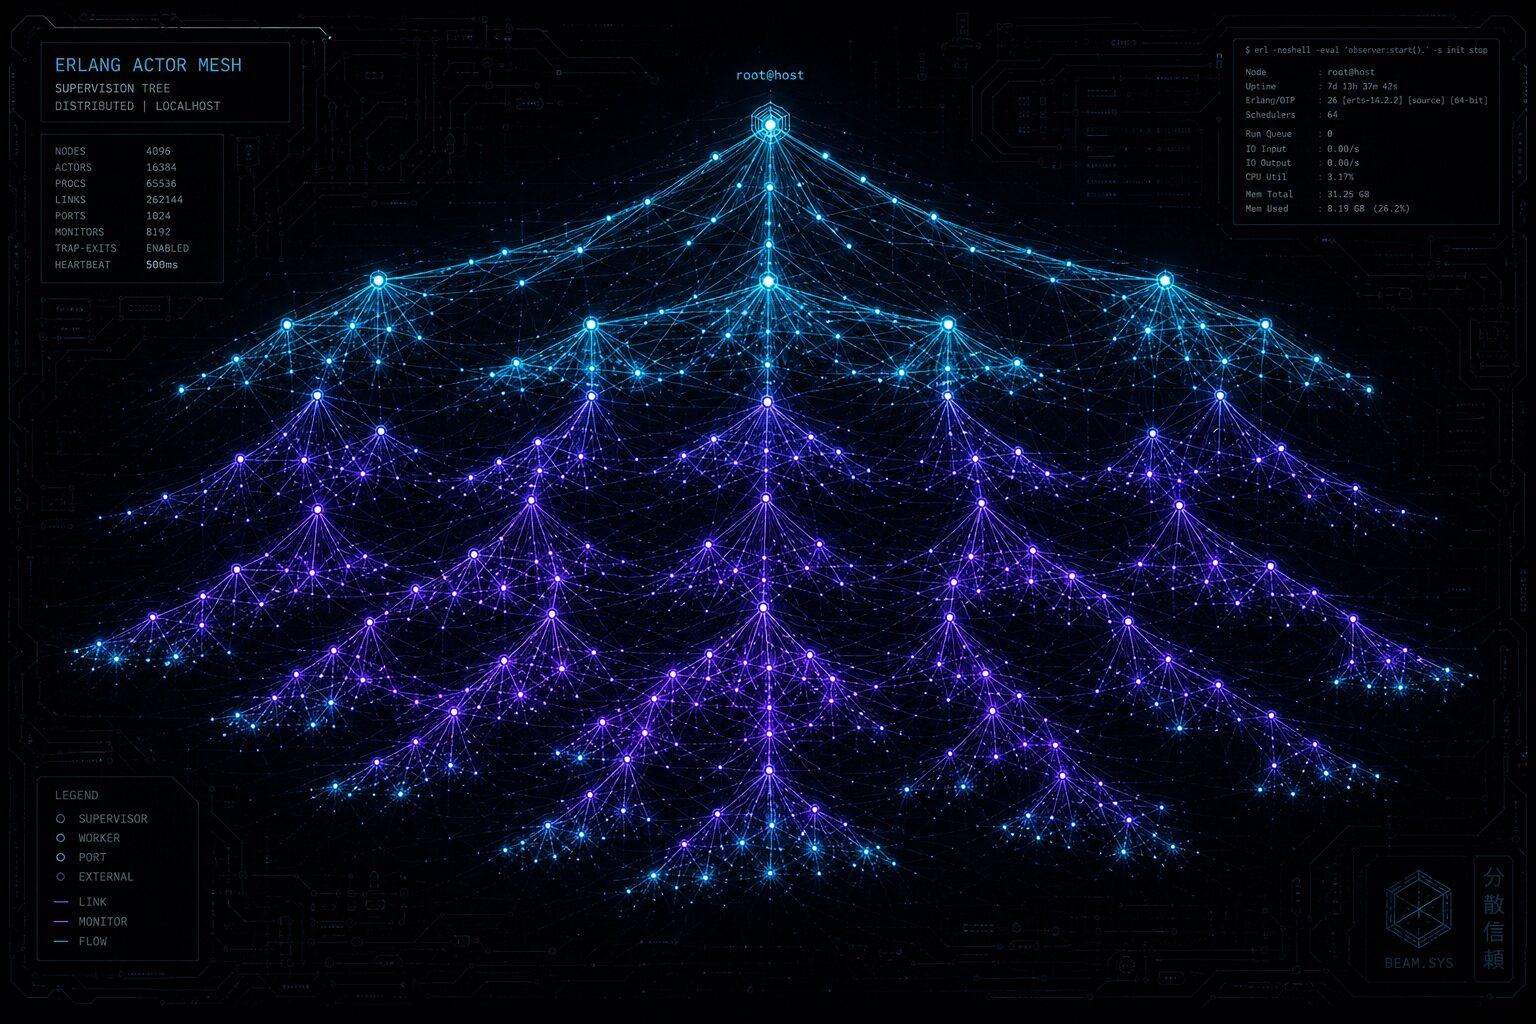
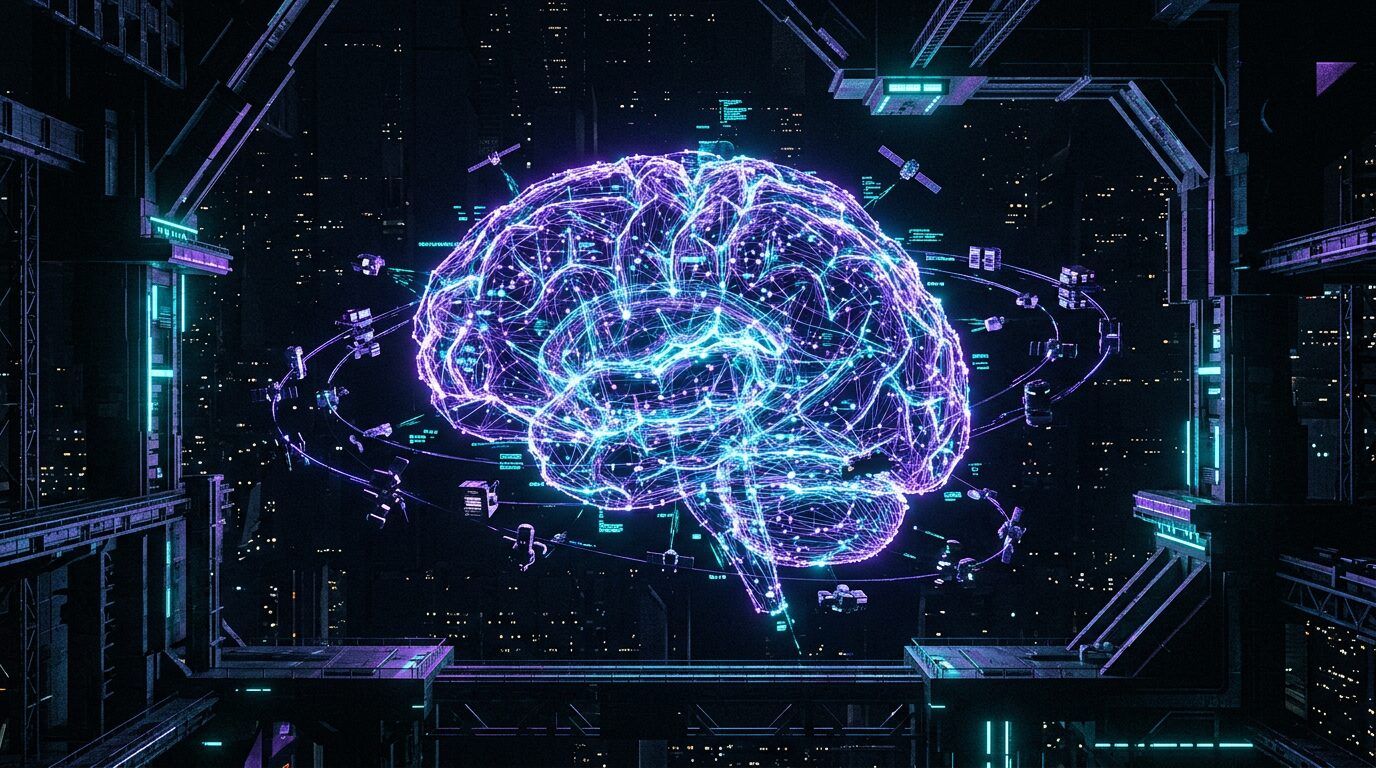
Obsidian is a note-taking app with a graph view. The futures thesis is that the graph is not a feature — it is the company brain, and the flat 2D graph is a placeholder for the 3D one. The SECTOR7 design calls for a 3D graph view, HUD-style, dark theme, neon, with clusters as glowing nodes and satellites — hovering violet, accepted cyan, executing green, rejected grey. The god mode view (P3.3) already proves Three.js renders the fleet as a tensor graph. The next step is the knowledge graph itself: entities, concepts, sources, and posts as nodes in space, with the SECTOR7 clusters orbiting the concepts they would extend. The brain becomes navigable — not a list of notes, but a world of ideas.
What we built
The knowledge graph is real: the S3 series documented 269 nodes and 1513 edges in the graph ledger (S3.8), the entity/concept/source schema (S3.2), and the index-as-query pattern (S3.4). The vault’s wiki folder holds the actual graph — entities like erlang-actor-mesh-prototype, concepts like multi-profile-agent-architecture, and the staging cluster cards ready to orbit. The P3.3 God Mode view is the rendering proof. The SECTOR7-RESEARCH-GRAPH-DESIGN is the spec for the 3D layer. The honest constraint is stated in the design: the Obsidian 3D graph plugin does not exist yet — this is a build, not a toggle.
The vision
The 3D graph renders the vault as a constellation: concepts at the core, entities orbiting, sources as satellites, posts as comets with trails. The SECTOR7 clusters hover near the concepts they extend — a bridge cluster floats between S5 and S9, a physical-ascension cluster orbits erlang-actor-mesh-prototype. A human orbits the constellation, inspects a hovering cluster, and accepts it. The graph is the company brain because it is where the company’s knowledge lives and where its ideas are born — rendered as space so it can be seen as a whole. The 2D graph was a map; the 3D graph is the territory.
What’s next
The next increment is the 3D renderer: reuse the P3.3 Three.js stack to render the vault’s wiki graph — nodes, edges, cluster satellites — from the existing markdown and JSON data. The spec exists; the renderer is a build.
Grounded in SECTOR7-RESEARCH-GRAPH-DESIGN, the S3 knowledge-OS series, the P3.3 God Mode view, and the vault wiki graph. Thirty-fifth article in the SECTOR07a futures series.