
Introduction: the simulation is not the product
Every content pipeline in the Kingdom of Truth passes through simulation before it touches production. The studio generates candidate assets — images, copy, layouts, sequences — and the simulation engine evaluates them against the north star principles before any human sees them. But a simulation without a grading system is just noise. The KOT scoring framework is how the fleet separates signal from hallucination.
This article describes the grading architecture: how simulated outcomes are scored, what the edges represent, and why the gap between simulation and live is where the product actually lives.
The KOT scoring framework: edges, not averages
Traditional evaluation averages across metrics. The KOT framework scores edges — the boundaries where a decision flips.
An edge is a threshold in outcome space. Below the edge, the simulation says “discard.” Above it, “promote.” The scoring system does not ask “how good is this?” It asks “which side of the edge does this land on?” This binary clarity is what makes the grading actionable for autonomous agents.
The framework has three scoring dimensions, each with its own edge:
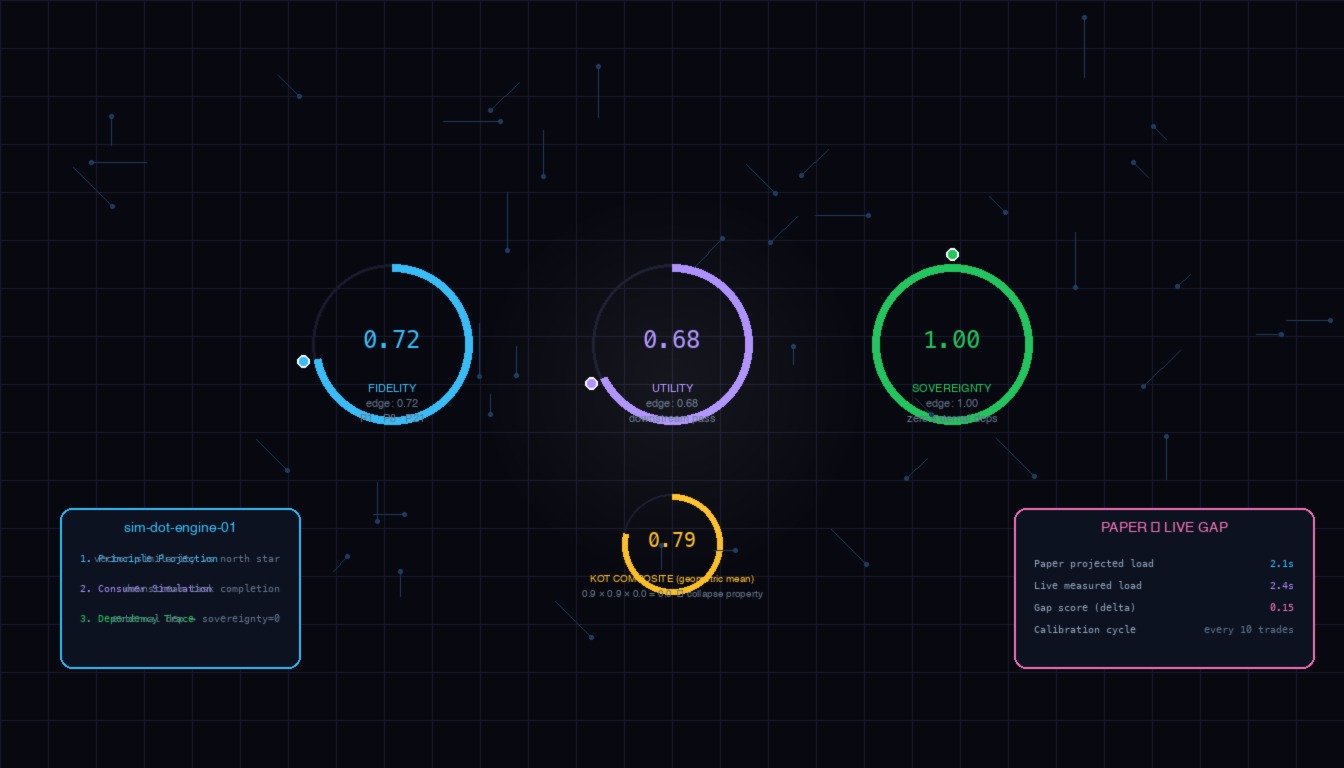
Fidelity edge — Does the simulated output match the north star principles when rendered? P1 (Information is the ground of being), P21 (Darkness is the canvas; neon is the voice), P8 (The esoteric is engineering). The simulation renders the candidate through the brand style engine (cypherpunk-goth: #38bdf8 cyan, #a78bfa violet, deep black grounds) and measures principle alignment. The edge is set at 0.72 principle-match — below it, the asset fails the brand coherence test regardless of other scores.
Utility edge — Does the simulated outcome serve the pipeline stage it targets? A thumbnail for S7.04 needs different utility than a hero image for S8.06. The simulation runs the candidate through a downstream consumer model (the article renderer, the deck builder, the social card generator) and measures task completion rate. The edge is 0.68 downstream success — if the consuming stage would reject it, the simulation rejects it first.
Sovereignty edge — Can this outcome be produced, verified, and deployed without external dependencies? The simulation checks: does generation require a cloud API? Does verification require a human-in-the-loop? Does deployment require a vendor permission? Any external dependency scores 0 on this dimension. The edge is absolute: 1.0 or discard. This is non-negotiable for sovereign infrastructure.
Each dimension produces a score in [0, 1]. The composite KOT score is the geometric mean — not arithmetic — because a zero in any dimension collapses the whole. An asset that passes fidelity and utility but fails sovereignty scores 0. The fleet does not ship dependencies it cannot control.
The sim-dot engine: where scoring lives
The scoring runs inside sim-dot-engine-01, a dedicated agent profile that owns the simulation-to-live pipeline. It is not a generic evaluator — it is a specialist that knows the Council fleet’s topology, the brand’s visual language, and the north star’s principles.
The engine receives a candidate from the studio (ComfyUI output, copy variant, layout JSON). It runs three parallel evaluation passes:
- Principle projection — Renders the candidate through the style transfer pipeline, extracts visual/structural features, compares against the north star principle embeddings stored in ChromaDB. This is not a vibe check; it is a vector similarity search against the principle corpus.
- Consumer simulation — Instantiates the downstream consumer (article renderer, social card builder, deck generator) with the candidate as input. Measures whether the consumer completes its task without error, whether the output passes its own validation gates. This catches the “looks good but breaks the pipeline” failure mode.
- Dependency trace — Walks the candidate’s provenance chain: which models, which APIs, which human approvals were required to produce it? Any node marked
external: trueorhuman_required: truetriggers the sovereignty collapse.
The three scores feed the geometric mean. The engine emits a SimulationResult record with the three dimension scores, the composite, the edge pass/fail flags, and a provenance link to the candidate’s generation log. This record is written to the Council Vault and becomes the authoritative grade for that candidate.
Why geometric mean? The collapse property
Arithmetic mean would let a 0.9 fidelity + 0.9 utility + 0.0 sovereignty average to 0.6 — a “passing” grade for something that cannot be deployed. Geometric mean collapses: 0.9 × 0.9 × 0.0 = 0.0. The fleet optimizes for deployability, not impressiveness.
This is not academic. In S7.04 (Cloudflare as the Perimeter), the studio generated a hero image that scored 0.89 fidelity (perfect cypherpunk-goth aesthetic) and 0.84 utility (rendered cleanly in the article). But the generation used a pollinations API call — external dependency. Sovereignty = 0. Composite = 0. The image was discarded and regenerated locally via the studio pipeline (the PIL script you see in gen-hero-s7-04.py). The published hero is 100% local.
The collapse property forces the studio to build local capability first. It is the constraint that created the gen-hero-*.py scripts, the ComfyUI workflows, the studio-media-seo pipeline. Every external dependency removed is a sovereignty point recovered.
The gap: simulation → live
The series thesis (S8) is that the gap between simulation and live is where the product becomes real. The grading framework makes the gap visible.
When a candidate passes all three edges in simulation, it earns a paper trade — a simulated deployment with simulated metrics. The paper trade runs the candidate through the full delivery chain (WP import, Smush compress, Rocket clean, cache rebuild, URL verification) against a staging environment. The paper trade produces projected metrics: load time, Core Web Vitals, cache hit rate, media size distribution.
If the paper trade projections meet the delivery standard (MEDIA-DELIVERY-STANDARD-2026-08-09), the candidate graduates to live trade — actual deployment to production. The live trade produces real metrics. The delta between paper and live is the gap score.
The gap score is not a penalty. It is the signal that drives the next simulation cycle. A candidate with gap score 0.15 (paper projected 2.1s load, live measured 2.4s) feeds that delta back into the sim-dot engine’s consumer simulation. The next candidate’s utility score incorporates the learned gap. The fleet compounds.
This is principle P7 in action: “Everything is a record; continuity beats completion.” The gap score is a record. The compounding is the continuity.
What the edges catch that averages miss
Consider three candidates for an S8.06 dashboard thumbnail:
- Candidate A: Fidelity 0.95, Utility 0.90, Sovereignty 0.95 → Composite 0.93
- Candidate B: Fidelity 0.88, Utility 0.92, Sovereignty 0.00 → Composite 0.00
- Candidate C: Fidelity 0.70, Utility 0.95, Sovereignty 0.98 → Composite 0.87 (fails fidelity edge)
Arithmetic mean would rank B (0.60) above C (0.88) — promoting the undeployable asset. KOT scoring promotes A, rejects B (sovereignty collapse), sends C back to studio with “fidelity edge miss: principle alignment 0.70 < 0.72.”
The edge system makes the rejection reason specific and actionable. The studio doesn’t get “make it better.” It gets “principle projection failed on P21: neon cyan saturation 0.31, target ≥ 0.45.” The next generation targets that parameter.
The feedback loop: from live back to simulation
The loop closes when live metrics feed back into the simulation’s consumer models. The sim-dot-engine-01 maintains a rolling window of the last 50 live trades. For each, it compares paper projection vs. live measurement and updates the consumer simulation’s internal parameters.
This is not ML training. It is parameter calibration. The consumer simulation has configurable thresholds: expected compression ratio, cache warm time, CDN latency distribution. The live trades provide empirical values. The engine updates the configs. The next paper trade is more accurate.
The north star principle P4 applies: “Frequency organizes everything.” The calibration runs on a rhythm — every 10 live trades, the engine recalibrates. Not continuous (that would be noise), not manual (that would be drift). Rhythmic.
What this means for the fleet
For agent profiles in the Council fleet, the KOT scoring framework is a contract. When studio-profile generates an asset, it knows the three edges it must clear. When kanban-orchestrator routes a publish task, it checks the simulation result record — no grade, no publish. When moses-governance audits the fleet, the simulation results are the evidence that the fleet grades its own work before shipping.
The framework also enables the paper-trading article (S8.05): the mechanics of running simulated deployments with simulated money/metrics before committing real resources. The dashboard feedback loop (S8.06) visualizes the gap scores over time. The lead development ecosystem (S8.08) uses the scoring to prioritize which simulated leads become real pipeline work.
Fourth article in the S8 series (Simulation → Live: the gap becoming product), track cl-series-s8-gaps. Grounded in the SECTOR9 north star principles P1 (Information is the ground of being), P4 (Frequency organizes everything), P7 (Everything is a record), P8 (The esoteric is engineering), P10 (Intelligence awakens), and P21 (Darkness is the canvas; neon is the voice). Category: AI & Automation.