The God Mode View: 3D Tensor Graphs of the Agent Swarm
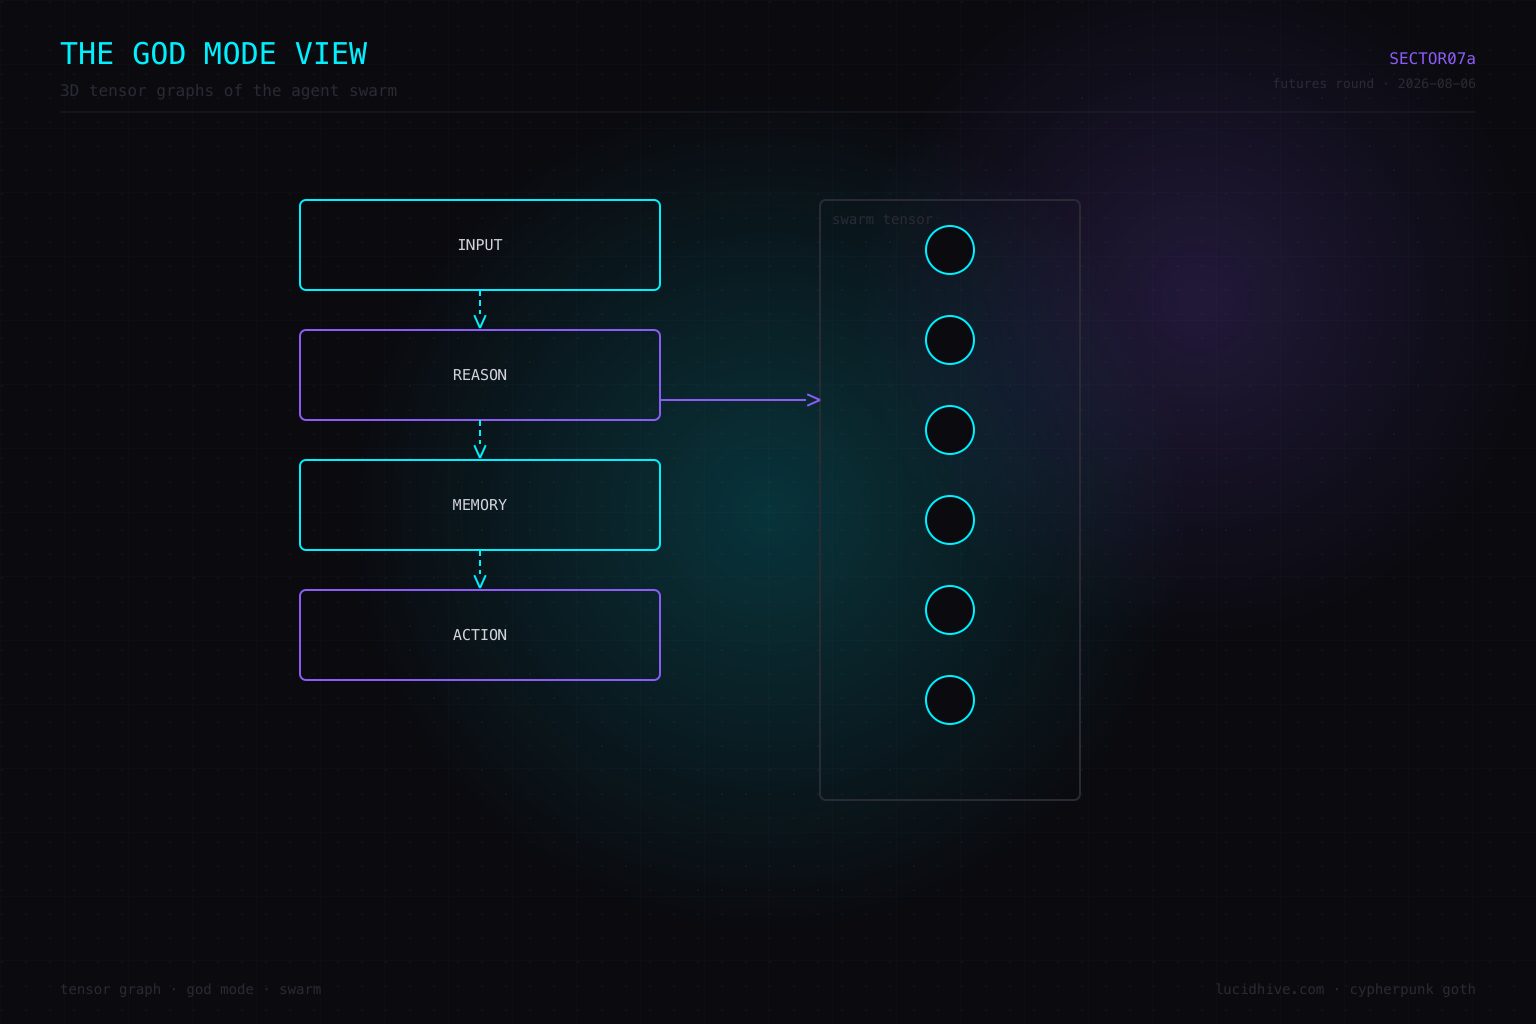
When a fleet grows to a hundred profiles and a thousand tasks, a kanban board is no longer a view — it is a ledger. The futures thesis is that the fleet needs a god mode: a 3D visualization where every agent is a node, every task is an edge, and the entire swarm is a tensor graph you can orbit, zoom, and filter in real time. The Kingdom of Truth already built the first version — the P3.3 God Mode View at dashboards/god-mode-view.html — showing the Council’s ten agents across four layers with Three.js. The future is that view scaled to the mesh: actors, supervisors, handoffs, and coherence scores rendered as a living constellation.
What we built
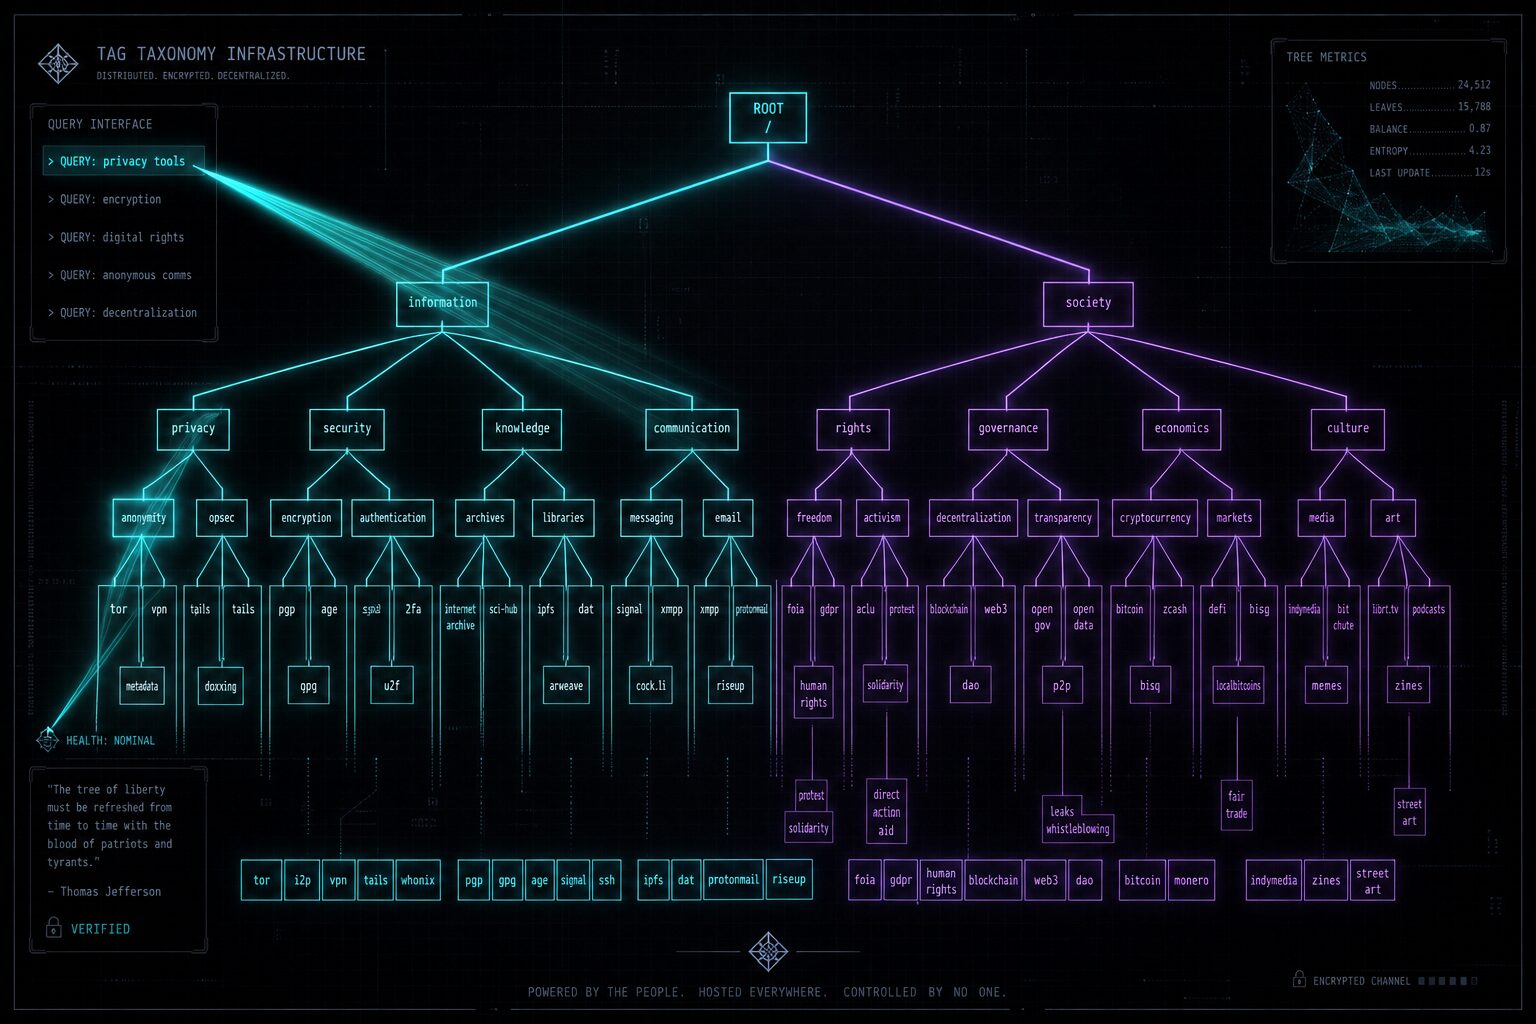
The P3.3 deliverable is real and inspectable: an interactive HTML visualization of the COUNCIL agent swarm using Three.js, with agents laid out across layers (Hermes at Layer 0, OpenClaw and the rest across the other layers), color-coded, navigable in 3D. The kanban-orchestrator and S5 series documented the underlying system — the board is the source of truth (S5.2), the dispatcher runs claims and heartbeats (S5.7), the hierarchy runs the Council of Three (S5.1). The visualization reads that same board and renders it as space. The S9.8 visual language gives the graph its aesthetic: dark base, neon cyan and violet nodes, high contrast, grain.
The vision
God mode becomes the operations dashboard: supervisors pulse green, crashed actors flash red, handoffs draw light trails, coherence scores change node brightness, and the whole scene is filterable by layer, by series, by status. When physical ascension adds robot nodes, they appear in the graph with their sensor streams as edges. The god mode is not decoration — it is the fastest way to see what the fleet is doing, and to notice what it is not doing. The knob room (SECTOR07a.22) is the public version of this view; god mode is the internal one.
What’s next
The next increment is to connect the visualization to live data: instead of a static snapshot, poll the kanban DB and re-render the graph as the board changes. The P3.3 file is the skeleton; live binding is the muscle.
Grounded in the P3.3 God Mode View deliverable, the S5 council-system series, the kanban-orchestrator skill, and the S9.8 visual language. Twenty-fourth article in the SECTOR07a futures series.