The
Customer Dashboard: Self-Service Portal for Agent Services
Draft — S6.7 · series: CONTENT-ROADMAP-99 S6 (Web 4.0 /
Digital Business) · status: DRAFT · grounding: system-overview ·
kot-os-competitive-analysis · cockpit-+-funnel · subscription-model ·
MASTER-INDEX-BRIDGE clusters · wiki_concepts: system-overview,
kot-os-competitive-analysis, cockpit-+-funnel, subscription-model,
service-plans, service-health-check · skills: hermes-agent,
kanban-orchestrator, lucidhive-wp-publish · tags: ai-agents,
customer-dashboard, self-service, web-4.0, digital-business,
subscription-model, agent-services, dashboard, service-portal,
local-first, cloud-optional, digital-architecture
The previous article in this series described the sovereign AI stack
— the four-layer architecture that keeps inference local, state durable,
and cloud an exception rather than a default. This article asks the next
question: once the stack exists, how does a customer actually
use it? Not the operator. Not the developer. The person who
pays $250 a month for an Agent Workforce subscription and wants to see
what their agents did this morning.
The answer is a dashboard. But not the kind most SaaS companies build
— a metrics wall with charts that prove you are getting value. The
customer dashboard for agent services is a different object entirely. It
is a self-service portal that gives the customer visibility into
autonomous work they did not directly initiate, control over the agents
that execute on their behalf, and the ability to steer without
micromanaging. Building this dashboard correctly is the difference
between a subscription that retains and one that churns.
Why agent
services need a different dashboard
services need a different dashboard
Traditional SaaS dashboards are designed for tools. You open the
dashboard, you click a button, you get a result. The dashboard is a
control surface for direct human action. Agent services invert this
relationship. The customer does not click “generate image” or “write
blog post.” The agents do that autonomously, on schedule, in response to
triggers the customer configured once. The dashboard’s job is not to
enable action — it is to report on action already taken and give the
customer the ability to redirect.
This is a fundamentally different UX problem. A tool dashboard says
“here is what you can do.” An agent dashboard says “here is what was
done, here is what is happening now, and here is where you can change
course.” The distinction matters because autonomous agents produce
output continuously. A customer who logs in to find twelve blog posts
published, four images generated, and two social media batches scheduled
does not need a “create new post” button. They need a view that lets
them review what happened, approve or reject specific outputs, adjust
priorities, and understand the system’s health at a glance.
The cockpit-and-funnel concept from the wiki describes exactly this
dual-view interface: operational monitoring (the Cockpit) combined with
pipeline visibility (the Funnel). For agent services, the Cockpit shows
what the agents produced and their current status. The Funnel shows what
is queued, what is in progress, and what is waiting for human approval.
Together they give the customer a complete picture without requiring
them to understand the underlying agent architecture.
The three layers of
customer visibility
customer visibility
A self-service portal for agent services needs three distinct
visibility layers, each serving a different customer need.
Layer 1: Status and health. The customer needs to
know that the system is running. This is where the service-health-check
concept applies directly. The dashboard shows which services are active
— inference engine online, creative agent producing, content pipeline
publishing — using the same port-based verification the Council uses
internally. A green indicator on each service tells the customer their
agents are operational. A red indicator tells them something is down and
gives them a clear path to escalate. The customer does not need to know
which port Ollama runs on. They need to know their agents can think.
Layer 2: Output and history. Every artifact an agent
produces is visible in the dashboard. Blog posts appear with their
publish status, metadata, and links. Images show thumbnails with
generation parameters. Social media batches display scheduled times and
platform destinations. The customer can browse what was created, click
through to the live content, and see the full timeline of agent
activity. This is not a log file — it is a curated view of creative
output, organized by date, type, and status.
Layer 3: Control and steering. The dashboard lets
the customer adjust agent behavior without touching configuration files.
Priority sliders for content types (more blog posts, fewer social
posts). Approval gates for specific content categories (all campaign
visuals require human review, product descriptions auto-publish).
Schedule overrides (pause all publishing during a holiday week). These
controls operate through the same kanban board the Council uses
internally — the customer’s adjustments become kanban cards that the
orchestrator dispatches to the appropriate specialist.
This three-layer design maps directly to the subscription tier
structure. Tier 1 (Hermes CLI, free) gets minimal dashboard — just
system status. Tier 3 (Agent Workforce, $250/mo) gets the full Cockpit
with output history and basic steering. Tier 4 (Full Stack, $2,000/mo)
adds the Funnel view with pipeline management and multi-agent
coordination. Each tier adds visibility, not complexity.
The self-service principle
Self-service is not a feature — it is an architectural commitment.
The customer must be able to accomplish every routine task without
contacting support. This means the dashboard must handle subscription
management (upgrade, downgrade, pause), agent configuration (add a new
content type, change publishing schedule), output review (approve,
reject, edit before publish), and billing transparency (see what was
consumed, what it cost, what is next).
The sovereign AI stack makes this easier than cloud-dependent
alternatives. Because the customer’s data is local, the dashboard reads
from the same SQLite database and ChromaDB instance the agents write to.
There is no API rate limit on dashboard queries. There is no additional
cost for dashboard access. The dashboard is a view into the customer’s
own infrastructure, not a separately hosted service that adds another
cloud dependency.
This is where the subscription model earns its monthly fee. The
subscription guarantee — build once, host forever, pay monthly to keep
running — means the customer’s dashboard and agents persist
indefinitely. But the value-delivery imperative means the dashboard must
continually demonstrate what the agents accomplished. A customer who
logs in and sees nothing new for a week will question the subscription.
A customer who logs in and sees a week of autonomous content production,
with clear metrics on output volume and quality, understands exactly
what they are paying for.
The approval gate
as the critical UX pattern
as the critical UX pattern
The most important element of the customer dashboard is the approval
gate. Autonomous agents produce output continuously, but not all output
should go live without human review. The dashboard must present pending
items clearly — here is a blog post that is ready to publish, here is a
campaign image that needs your sign-off, here is a social media batch
that will go live in four hours unless you modify it.
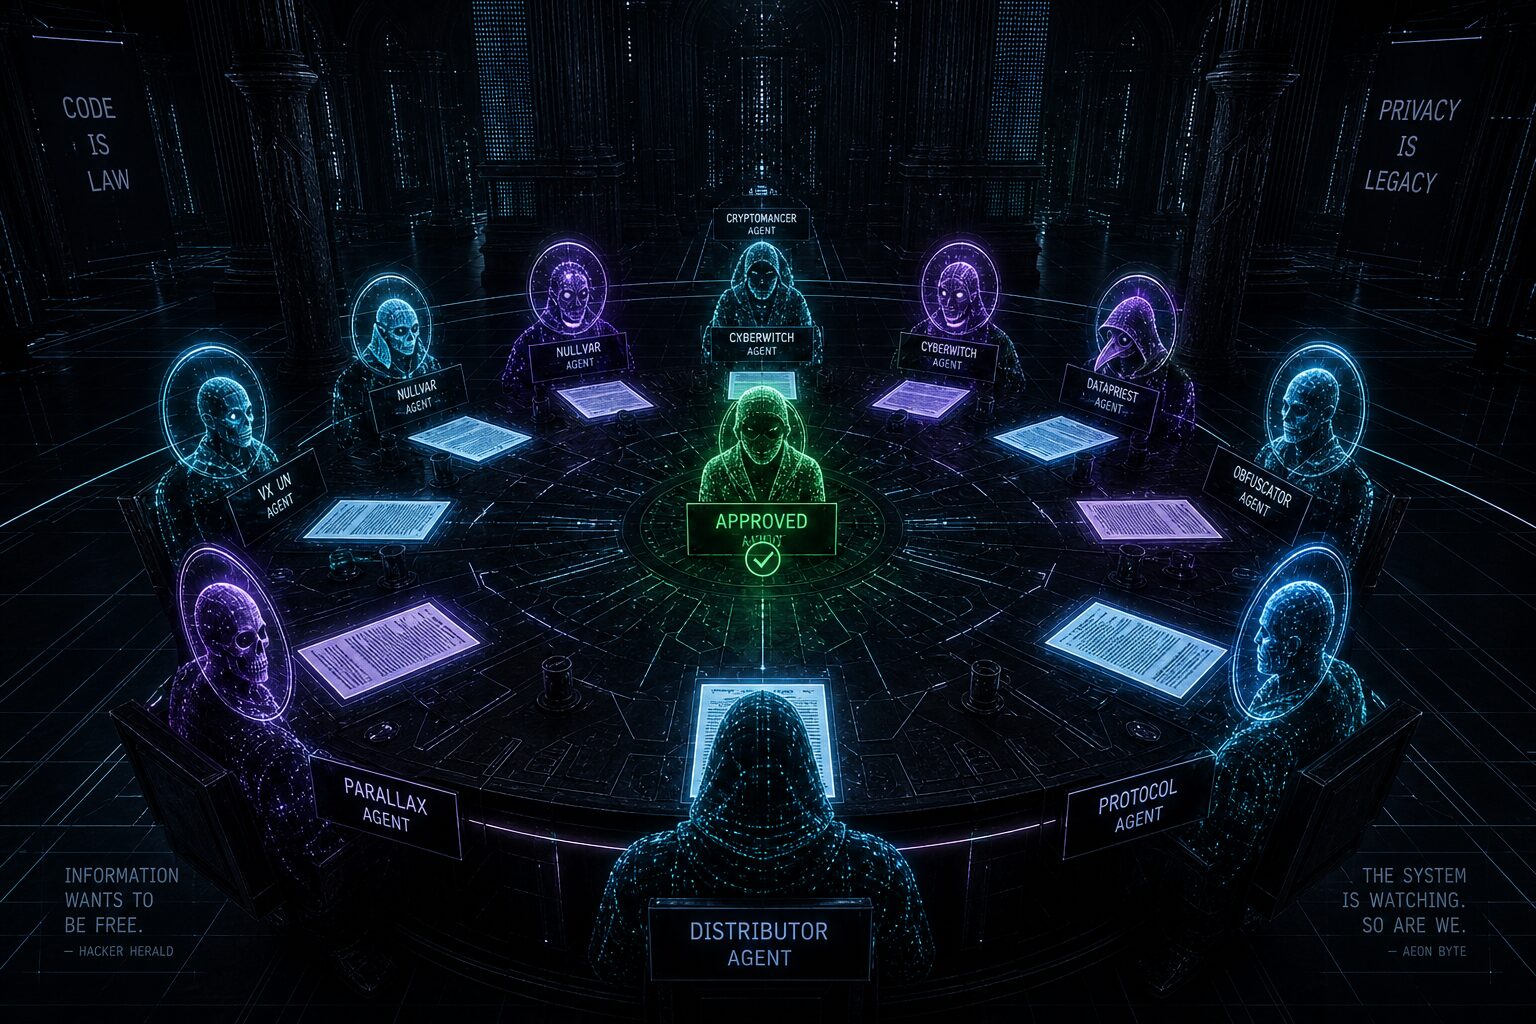
The approval gate is a kanban card. The agent produces an artifact,
writes it to the vault, and signals completion on the kanban board. The
dashboard surfaces this as a pending item. The customer reviews it,
approves or rejects it, and the system proceeds. This is the narrow gate
principle applied to the customer interface — the agent’s output passes
through a human permission surface before touching the outside
world.
The gate also enables progressive autonomy. New customers start with
everything requiring approval. As they build trust in the system, they
relax specific gates: product descriptions auto-publish, but campaign
visuals always require review. The dashboard tracks approval history and
can suggest which gates to relax based on the customer’s rejection rate.
A customer who has approved 97% of blog posts without edits is a
candidate for auto-publish on that content type. The system learns the
customer’s preferences through their approval behavior, not through
configuration forms.
Why this matters for Web 4.0
Web 4.0 is the era where AI becomes infrastructure, not a feature.
The previous web generations gave customers tools (Web 1.0), platforms
(Web 2.0), and protocols (Web 3.0). Web 4.0 gives customers agents —
autonomous systems that act on their behalf. The customer dashboard is
the interface between the human and the agent fleet. Get it wrong, and
the customer feels surveilled by their own infrastructure. Get it right,
and the customer feels empowered — their agents are working, they can
see the work, and they can steer it without being dragged into the
technical details.
The Kingdom of Truth’s approach to this problem is architectural, not
cosmetic. The dashboard reads from local state. The agents write to the
same database. The approval gate uses the same kanban board. There is no
separate “customer portal” service to maintain, no additional cloud
dependency, no API layer between the customer and their own data. The
dashboard is a view into the system the customer already owns. That is
what self-service means when sovereignty is the foundation: the customer
serves themselves because the infrastructure is theirs.
Grounded in the wiki concepts system-overview,
kot-os-competitive-analysis, cockpit-+-funnel,
subscription-model, service-plans, and
service-health-check, plus the MASTER-INDEX-BRIDGE clusters
on Web 4.0 / digital business management. Seventh article in the S6
series on Web 4.0 and Digital Business. Follows S6.2’s coverage of the
sovereign AI stack; this one specifies the customer-facing interface
layer.