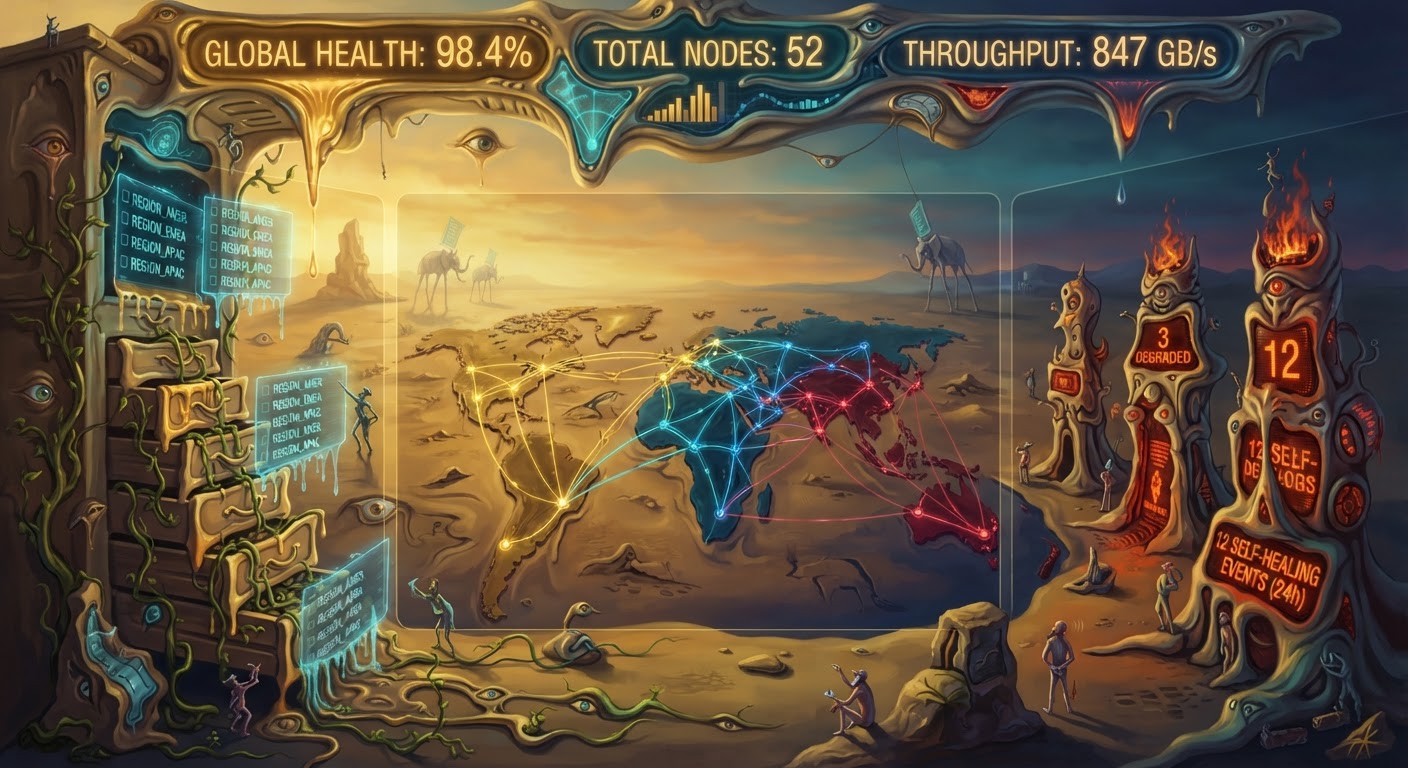

Most enterprise dashboards lie to you. They show a sanitized world where every node is green, every metric is trending up, and every problem is someone else’s department. The reality of a 50-node mesh is messier, more interesting, and ultimately more honest — if you know what to look for.
The Enterprise Operations Dashboard isn’t a monitoring tool. It’s a lens into a living system. When you run your own mesh — your own network of interconnected nodes, controllers, and endpoints — the dashboard becomes the single pane of glass that tells you whether your sovereignty is intact or whether someone else’s infrastructure has crept back in.
The Mesh at a Glance
Fifty nodes. That’s not a lab experiment — it’s a real deployment. A mid-sized business running its own camera network, its own compute cluster, its own data pipeline, its own identity layer. No cloud dependency. No vendor lock-in. Every byte stays on your wire, in your building, under your control.
The dashboard breaks this into three essential views:
Node Health. Each of the 50 nodes reports its status in real time — uptime, memory pressure, network latency to its neighbors, and self-healing event counts. When a node drops below threshold, the mesh doesn’t panic. It reroutes. The dashboard shows you exactly where the traffic shifted and why.
Regional Topology. The mesh isn’t flat. It’s organized into regions — Americas, EMEA, APAC, LATAM — each with its own controller. The topology view shows you the connections between regions, the CRDT sync status, and which edges are carrying the most traffic. This is the view that tells you whether your geo-sovereignty is holding: data in EMEA stays in EMEA, data in APAC stays in APAC.
Throughput and Self-Healing. The aggregate metrics matter, but not as much as the patterns. 847 GB/s across 52 nodes sounds impressive — until you realize three nodes are degraded and twelve self-healing events fired in the last 24 hours. The dashboard doesn’t hide these. It highlights them. Self-healing is a feature, not a failure. The mesh fixed itself twelve times overnight. You slept through all of it.
Why Sovereignty Requires Visibility
The Love Equation governance model — the framework that underpins everything in the Mesh-in-a-Box philosophy — starts with a simple principle: you cannot govern what you cannot see. Traditional cloud deployments hand you a dashboard that shows you what the vendor wants you to see. Status pages that are always green. Metrics that are always within SLA. The occasional “incident” that gets “resolved” without you ever understanding what happened.
A sovereign mesh inverts this. You see everything because you own everything. The 50-node dashboard doesn’t just show you node health — it shows you the governance layer. Which nodes are following the mesh protocol. Which ones have drifted. Which regions are in sync and which are catching up. This is algorithmic governance in practice: the mesh enforces its own rules, and the dashboard makes those rules visible.
This is the security-services story reframed for the enterprise. When a business runs its own mesh, the question shifts from “how do we secure our cloud?” to “how do we secure our network?” The answer is the same one that works at home — own your sensors, own your compute, own your data — but scaled to fifty nodes and multiple regions. The dashboard is the proof that it’s working.
Self-Healing Is the New Normal
Twelve self-healing events in twenty-four hours. On a traditional infrastructure, that would be a war room. On a mesh, it’s Tuesday.
Self-healing isn’t about preventing problems — it’s about responding to them faster than any human could. When a node detects that its neighbor is struggling, it doesn’t wait for an alert. It redistributes load. When a region loses its controller, the mesh elects a new one in milliseconds. When a network partition heals, the CRDT layer reconciles the divergence without data loss.
The dashboard makes this visible. Each self-healing event gets logged, timestamped, and categorized. Not because you need to debug them — the mesh already did — but because you need to understand the patterns. If three nodes in the same rack keep triggering events, that’s a hardware issue. If one region’s events are consistently higher than others, that’s a capacity issue. The dashboard turns operational noise into strategic intelligence.
The Programmable Web, Finally Realized
The tags on this article read like a manifesto: API-First Architecture. Data Permanence. Autonomous Site Operations. These aren’t buzzwords on a mesh — they’re architectural constraints that the dashboard enforces.
API-First Architecture means every node exposes a clean interface. The dashboard consumes those interfaces to build its view. There’s no proprietary protocol, no vendor SDK, no locked-down API that stops working when your contract expires.
Data Permanence means the dashboard itself is backed by the same storage layer as everything else. Your metrics don’t disappear when a vendor decides to change their retention policy. They live on your nodes, in your regions, under your governance.
Autonomous Site Operations means the mesh can run without you watching the dashboard. The dashboard is for understanding, not for babysitting. The mesh heals itself, scales itself, and protects itself. You check the dashboard to make sure the sovereignty model is intact — not to respond to alerts.
The Home-to-Business Calibration
The Mesh-in-a-Box narrative started with home security — the idea that you could run a five-node mesh in your house and own your surveillance. The Enterprise Operations Dashboard is what happens when that idea scales. The same principles apply: own your sensors, own your compute, own your data. But at fifty nodes, across multiple regions, with CRDT synchronization and self-healing — the complexity increases, but the philosophy doesn’t change.
This is the re-calibration. The security-services industry has spent decades convincing businesses that they need someone else’s cloud to be secure. The mesh says otherwise. Build your own network. Run your own dashboard. Watch your own nodes. When the dashboard shows 98.4% global health across 52 nodes, that’s not a vendor’s promise — it’s your own infrastructure, reporting to you, on your terms.
The Enterprise Operations Dashboard doesn’t just show you a 50-node mesh at a glance. It shows you what sovereignty looks like when you actually build it.