

The Compliance Dashboard: The Love Equation Governing Continuously
Compliance is a snapshot. That is the problem. An auditor walks in, examines a moment in time, writes a report, and leaves. The report is accurate for the instant it was taken. Everything before it is history. Everything after it is faith. The organization spends the next twelve months hoping nothing changed between the snapshot and the next audit.
This is how compliance works in every regulated industry: healthcare, finance, defense, legal. Periodic examinations. Manual evidence gathering. Checklists that reference policies written years ago. The report says “compliant” and everyone exhales — until the next incident, the next breach, the next discovery that the snapshot was a photograph of a system that had already moved.
The Mesh-in-a-Box inverts this. Compliance is not a snapshot. It is a continuous state, governed mathematically, visible in real time.
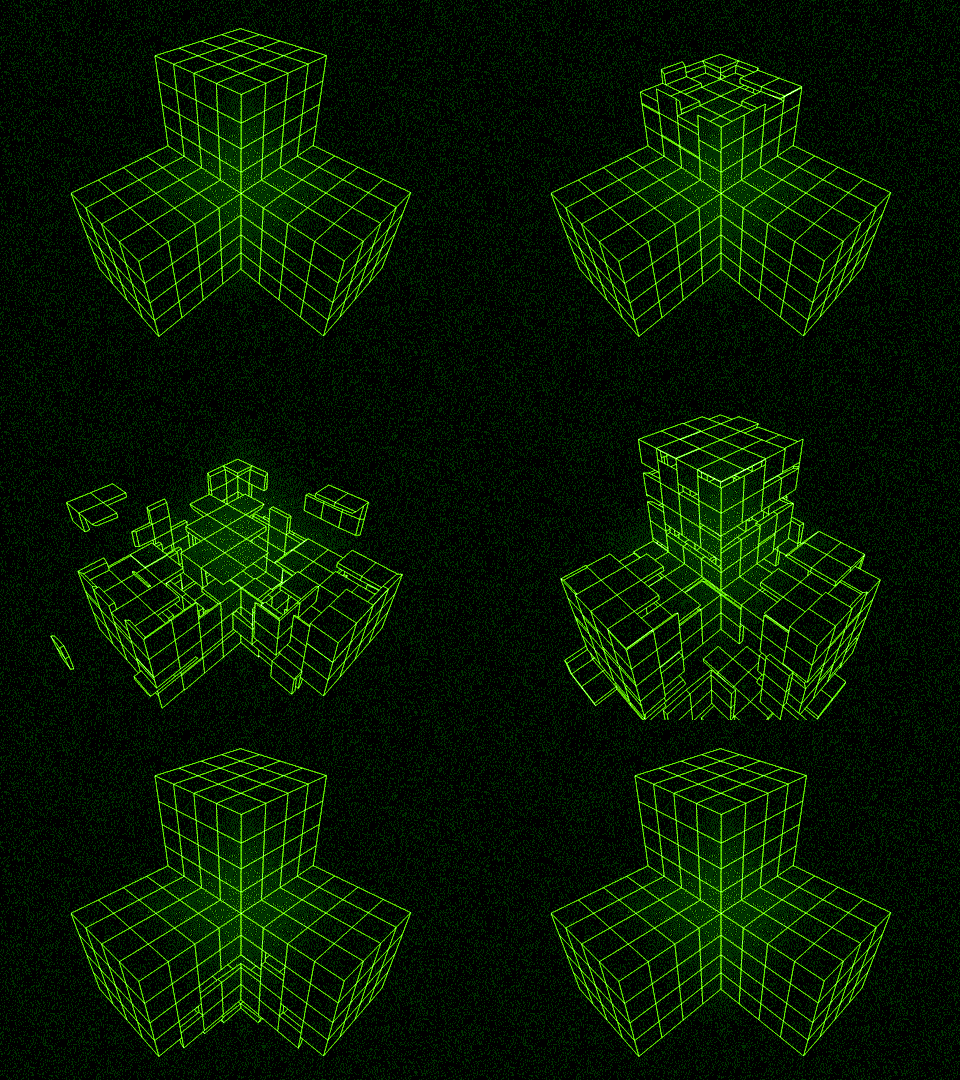
The Snapshot Problem
Traditional compliance dashboards display the results of periodic audits. A pie chart showing the percentage of controls that passed. A bar graph of open findings. A red-yellow-green status indicator that changes when someone manually updates it. The dashboard is a photograph of a photograph.
The failure modes are structural:
- Temporal blindness. The dashboard shows where you were, not where you are. Between audits, drift accumulates undetected. Configuration changes, access pattern shifts, resource reallocations — all invisible until the next examination.
- Manual evidence. Someone must gather logs, compile reports, cross-reference access records. The evidence is curated, not continuous. What gets included is a choice. What gets excluded is a risk.
- Point-in-time scoring. A compliance score of 94% means 94% of controls were operating correctly at the moment of examination. It says nothing about the other 364 days.
- No causal chain. The dashboard shows what passed and what failed. It does not show why. The drift that caused a failure is not captured because the drift was not measured continuously.
This is governance by photography. You take a picture, frame it, hang it on the wall, and call it a process.
Continuous Governance Through the Love Equation
The Mesh-in-a-Box replaces the snapshot with a differential equation that runs every cycle, on every node, without interruption.
dE/dt = β(C−D)E
This is the Love Equation. It is not a metaphor for governance. It is governance. Every node on the mesh evaluates this equation continuously. Coherence (C) measures how well current operations align with the organization’s stated values and regulatory obligations. Drift (D) measures deviation from those values. Energy (E) measures resource commitment to governance activities. The learning rate (β) scales the system’s response to detected drift.
The derivative dE/dt tells you something no snapshot ever could: whether compliance is improving or degrading in real time. Not whether it was acceptable at 2:00 PM on audit day. Whether it is getting better or worse, right now, on this node, in this cycle.
When coherence exceeds drift, the system reinforces. When drift exceeds coherence, the system flags, isolates, and corrects. This happens on every cycle. Not quarterly. Not annually. Continuously.
What the Dashboard Actually Shows
A compliance dashboard built on the Love Equation looks fundamentally different from a traditional compliance report. It does not show a static score. It shows a living system.
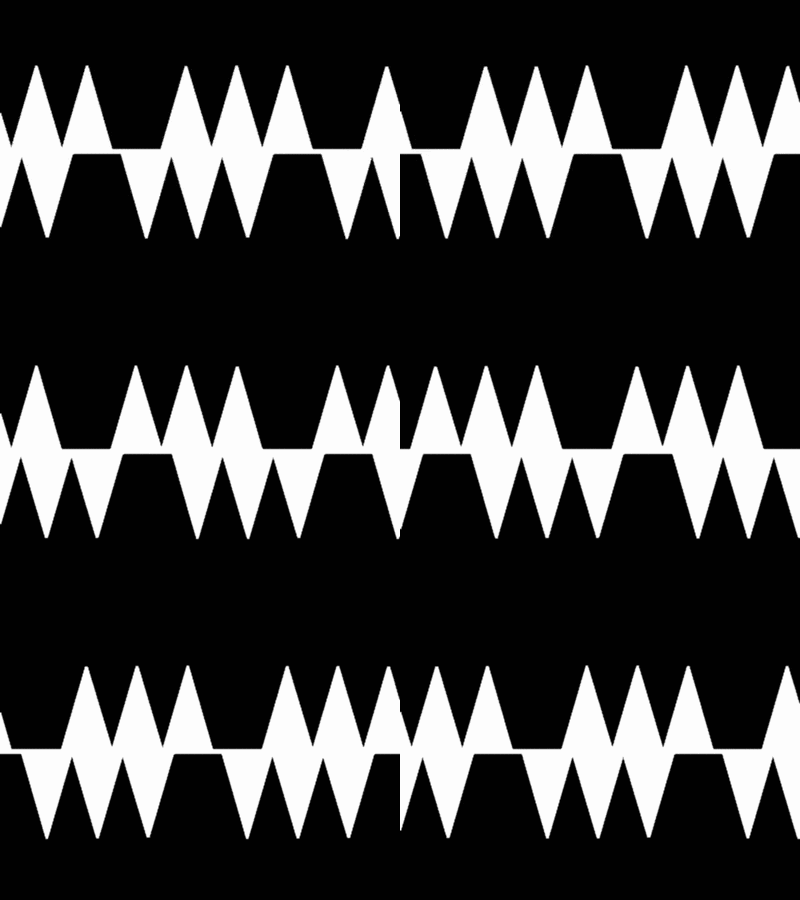
Coherence Waveform. A real-time graph of the coherence metric across all nodes. When a node’s operations align with governance values — data stays on-premise, access patterns match role permissions, encryption is applied to all sensitive data — the waveform stays high. When a node drifts — a misconfigured sync, an unauthorized access attempt, a resource leak — the waveform dips. The dip is visible immediately. Not in the next audit cycle. Now.
Drift Detection Timeline. A scrolling log of every drift event, timestamped, with the causal chain intact. Not “control 4.2 failed” but “node 7 attempted replication to external endpoint at 14:32:07 UTC, drift spike detected, supervisor intervention triggered, replication blocked.” The evidence is not gathered. It is generated, continuously, as a byproduct of the governance process itself.
Energy Allocation Map. A visualization of how governance resources are distributed across the mesh. Are nodes investing enough energy in compliance activities? Is one node Shouldering disproportionate governance load? The Kelly Criterion adjusts allocation dynamically, ensuring no single point of failure in the governance layer.
Inference History Log. Every decision the governance layer made, every intervention it triggered, every correction it applied — recorded in an immutable log on the mesh. Not in a cloud service’s audit trail. Not in a third-party SIEM. On your hardware, under your control, governed by your keys.
The Security Services Recalibration
The compliance dashboard is where the Mesh-in-a-Box sovereignty thesis meets the security-services business model. A security company does not sell cameras. It sells assurance. The assurance that client footage is protected, that access is governed, that chain of custody is maintained, that compliance with regulatory requirements is verifiable.
Under the traditional model, this assurance is periodic — quarterly reports that clients read, sign, and file. Between reports, the assurance is faith-based. Under the mesh model, the assurance is continuous. The compliance dashboard shows the client, in real time, that their footage is encrypted with their keys, stored on their premises, governed by the Love Equation, and auditable at any moment. The client can query any node: “What is your current coherence?” The answer is mathematical, timestamped, and cryptographically signed.
This is the home/business re-calibration. The same mesh that runs your home security cameras runs the security company’s evidence storage. The same Love Equation that governs your family’s data governs the client’s footage. The same compliance dashboard shows both — because the governance model is the same. One architecture. Sovereign partitions. Continuous compliance.
The Audit Trail as Product
Here is the shift that traditional compliance cannot make: the audit trail becomes a deliverable, not a burden.
Under the snapshot model, producing audit evidence is cost. Someone must gather it, format it, present it. The evidence is retrospective — it proves what happened, after the fact.
Under the continuous model, the audit trail is generated as a byproduct of governance. Every Love Equation cycle produces a record. Every drift detection produces a record. Every correction produces a record. The records are immutable, cryptographically signed, stored on the mesh. When an auditor arrives, the evidence is not gathered. It is already there. Complete, continuous, and cryptographically verifiable.
The compliance dashboard does not just show compliance. It produces compliance evidence as a continuous output. The dashboard is the audit trail. The audit trail is the dashboard. They are the same system, viewed from different angles.
The Irreducible Advantage
Some regulations cannot be satisfied with periodic evidence. Healthcare data residency, financial transaction monitoring, defense contractor security — these require proof of continuous compliance, not periodic snapshots. The mesh closes this gap with a governance model that runs every cycle, on every node, continuously, and produces its own evidence as a byproduct of its own operation.
The Love Equation does not take snapshots. It does not sleep between audits. It does not rely on a human remembering to run the compliance scan. It governs continuously because governance is what it is — not what it does occasionally.
The compliance dashboard is the window into this continuous governance. It is the place where sovereignty becomes visible, where the math becomes readable, where the organization can see — not believe, not hope, not trust, but see — that its values are being enforced, right now, on every node, continuously.
This is Article G9 in the Mesh-in-a-Box narrative series: supporting the T1–T5 arc with deeper dives into sovereignty, security, and the Love Equation governance model. The compliance dashboard is continuous governance made visible — not a photograph of compliance, but a living system that governs and proves itself in real time.
## Semantic Relationships
– [[love-equation]] — governance math
– [[platonic-solid-access-architecture]] — identity layer
– [[erlang-actor-mesh]] — enforcement runtime
– [[cybernetic-ethics]] — continuous compliance
– [[sovereign-infrastructure]] — ownership model