
KPI Mega Dashboards: Actionable Analytics on Your Own Stack
A screen full of numbers can still be a rearview mirror. It may show activity without separating signal from noise, or a decline without naming the person who can act. An actionable dashboard joins current state, a time baseline, an operational cause, and a bounded response. When a threshold changes, it makes the next responsible move visible.
That distinction matters when agents can turn a metric into a retry, a budget decision, a route change, or a human escalation. A number that cannot explain why it matters is decoration. A number connected to a safe response becomes infrastructure.
Start with the decision
The fastest way to build a useless mega dashboard is to collect everything and let the interface decide what matters. A chart library renders; it does not supply strategy. Before writing a query, define four fields: the uncertainty the number reduces, the owner who can respond, the smallest safe action, and the evidence that the response worked.
A conversion rate may matter to growth and be irrelevant to infrastructure. Queue depth may matter more than completed tasks when the question is whether new work should be accepted. A visible, assigned blockage can be more useful than a green completion counter. One question per panel keeps the surface honest and makes obsolete metrics removable.
Information is the ground of being, but information needs lineage. If a value cannot be traced to a source, calculation, and timestamp, it is a claim. The dashboard is a projection of records, not the record itself.
Four layers make telemetry actionable
A sovereign KPI surface can be built in four layers.
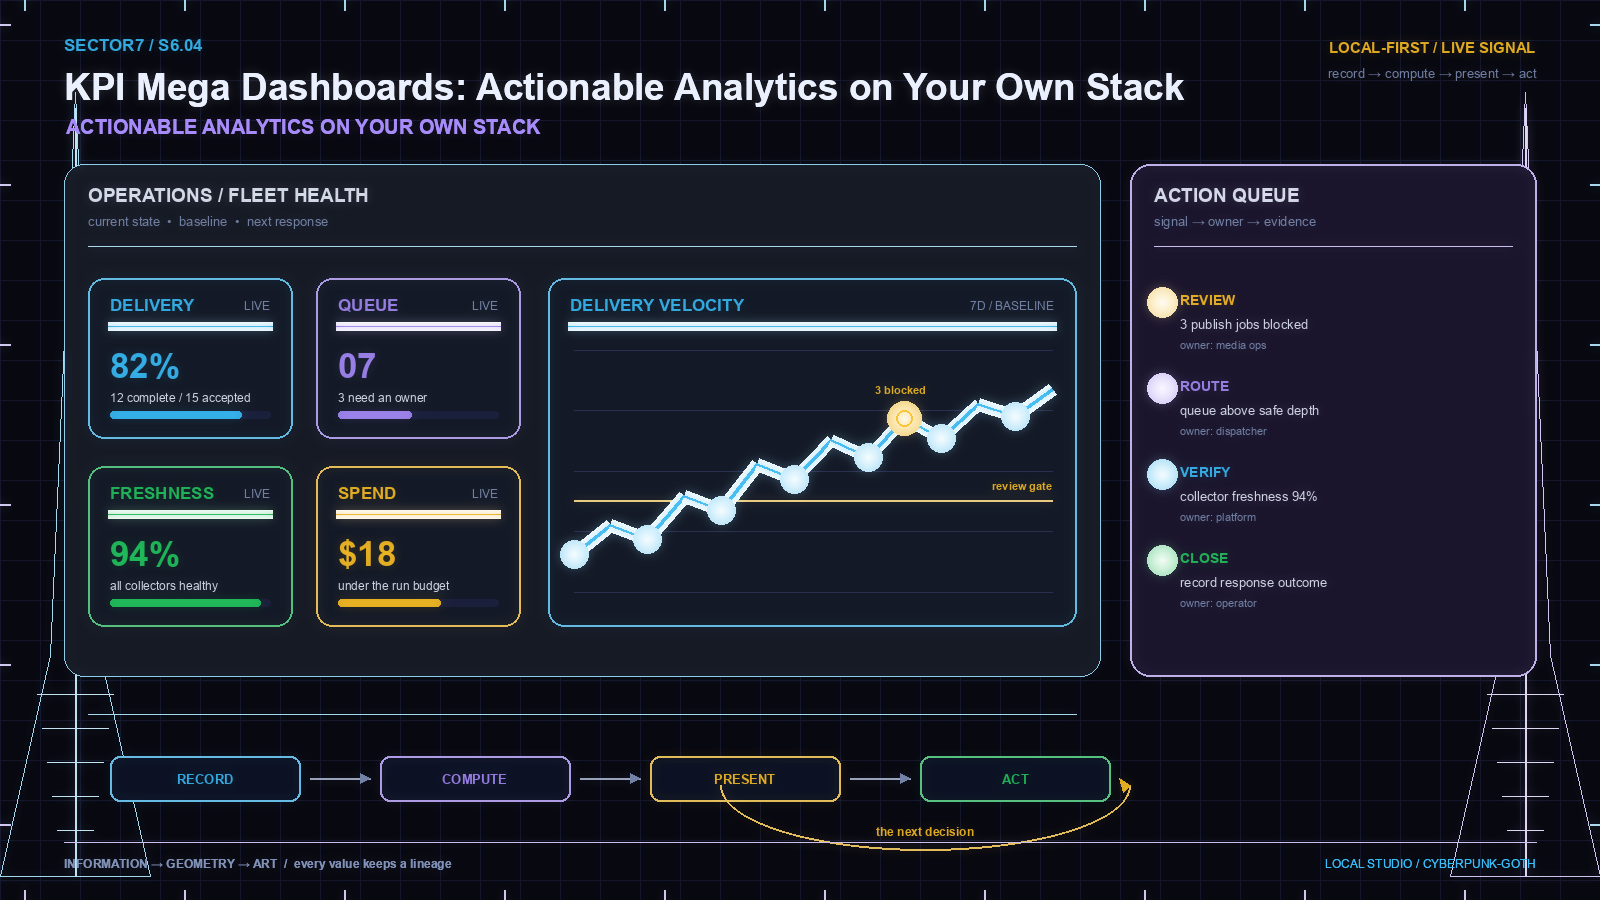
Record: services write structured events with a stable identifier, time, source, and payload. A task, deployment, media delivery, or customer outcome should exist outside the dashboard before it appears on screen.
Compute: queries distinguish counts from rates, current values from deltas, and observations from conclusions. Freshness travels with every result. A correct value from a dead collector is not current information.
Present: panels group state by decision: executive health, delivery, reliability, and action queue. Values show their unit, window, and comparison basis. A legend must explain the operating contract, not merely say “good” or “bad.”
Act: a meaningful change can open a review gate, attach evidence, narrow scope, create a task, or notify an owner. The response should be explicit and reversible rather than an unexplained autonomous mutation.
Observation ends at presentation. Action starts when the signal becomes a bounded, recorded response.
Keep the health score inside its boundary
A public article can describe categories such as flow, blockage, health, delivery, and resource pressure without exposing internal formulas, weights, thresholds, or client values. That is the GEMS boundary in practice. A metric name is not automatically secret; a derivation, credential, raw customer datum, or internal routing rule is.
A raw event is not a conclusion, and a composite score is not a source of truth. The operator may need the current value and its provenance; the public reader needs the principle and outcome. Mark fields as public, internal, or restricted in the data model, and require an explicit export path. Rich operations do not require public disclosure of how a protected score is calculated.
Local-first is about authority
Owning the stack does not mean pretending the cloud does not exist. It means deciding where the source of truth lives, where computation happens, and which dependencies may affect a decision.
A remote API can enrich a local dashboard without becoming authoritative. If it is missing, stale, or contradictory, the system should preserve the last verified local state and say so. Portability is the stronger goal than isolation: export the events and derived tables, document the schema, and recover the operating picture on another machine.
This changes the economics of observability. The dashboard is not rented with the subscription that produced the data. Historical records can be inspected, backed up, and compared over time. A provider outage can interrupt a convenience, not erase the ability to understand the business.
Trends become operational memory
A snapshot says where the system is. A trend says whether it is changing. A lower completion count can mean lower demand, a blocked queue, a broken collector, or a deliberate quality gate. The number alone is ambiguous.
Preserve the current value, prior window, expected range, and absolute change together. Mark missing intervals instead of drawing a false line through them. A weekly review can then compare expected movement with observed movement and ask why. A new worker inherits the history; a failed release gains context; a known trap can be avoided.
Continuity beats completion. The valuable record is not only the current chart, but the comparison, the decision made from it, and the outcome that followed.
Calm is a feature
Cyberspace does not need another wall of blinking numbers. Darkness can be the canvas and neon the voice, but spectacle must not compete with judgment. Use saturated cyan for healthy signal, violet for a related state, and restrained gold for a decision that needs an owner. Group panels by the question they answer.
Name the condition, scope, and next move: “three publish jobs are blocked; review the media dependency” is more useful than “critical queue anomaly.” A good surface transmits clearly. The fleet should be able to listen without decoding an elaborate visual dialect first.
Close the loop
The strongest KPI mega dashboard is not the one with the most panels. It is the one that keeps a decision honest from signal to record:
- Choose one decision and define its supporting metric.
- Capture the source event with provenance and freshness.
- Render value, baseline, window, and threshold together.
- Connect meaningful change to an owner or recorded gate.
- Preserve the response and compare its result with the baseline.
- Promote the lesson into the operating record and remove metrics that no longer earn their place.
Collect locally where the source of truth belongs. Compute transparently. Present calmly. Act reversibly. Record what matters. The dashboard then stops being a display you visit and becomes a system that gives the next decision a visible signal, a named owner, a bounded action, and a record that survives the next cycle.