
The Dashboard as Simulation Instrument: When Analytics Feed Back Into the Loop
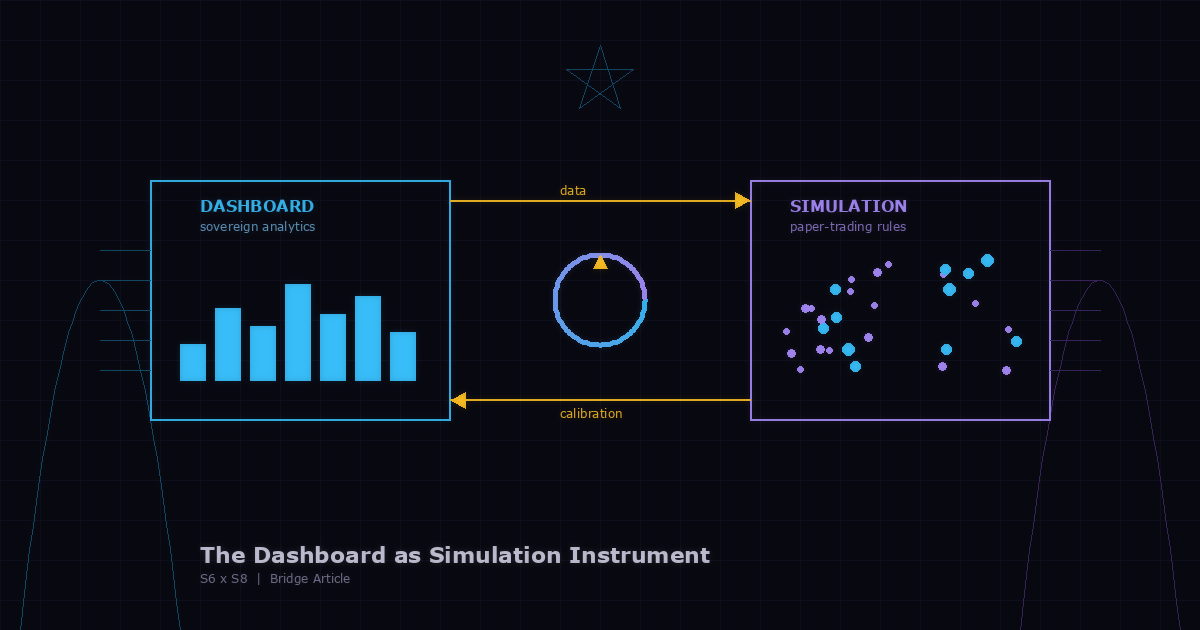
Every dashboard you have ever used was built to show you what happened. Some of them are ambitious enough to show you what is happening right now. Almost none of them are designed to change what happens next. The S6 series made the case for owning your analytics — running dashboards on sovereign infrastructure so your operational intelligence never leaves your network. The S8 series made the case for simulation — paper-trading real rules against synthetic outcomes so decisions are tested before they cost anything. The bridge between them is the insight that neither series achieves alone: a dashboard that does not merely report, but feeds back into the system that produced it.
The reporting trap
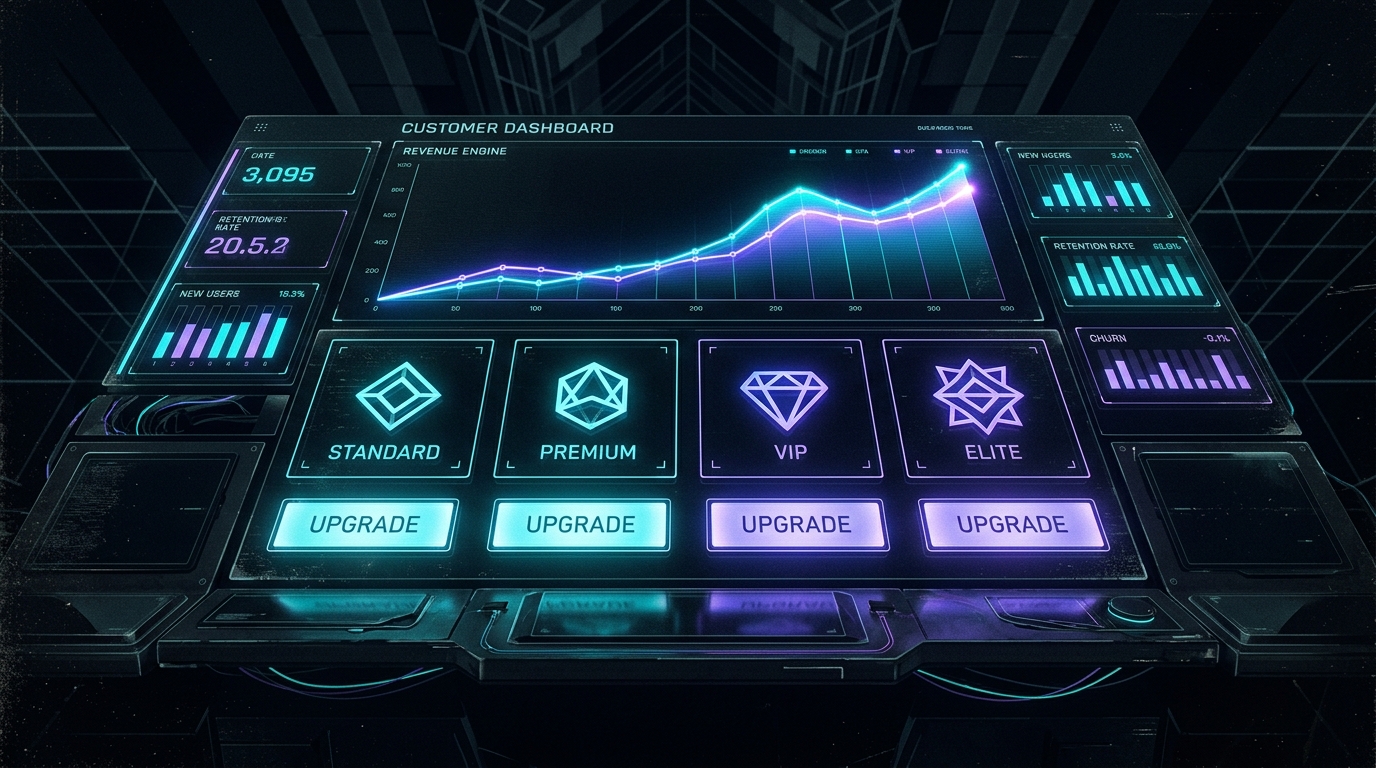
The S6 series identified the analytics dependency problem. Most businesses route their operational data through third-party dashboards: Google Analytics for traffic, a SaaS tool for operations, an accounting platform for finances. Each one requires an API key, a data processing agreement, and a subscription. Each one stores your data in a cloud you do not control. The S6 solution was structural sovereignty — collect locally, compute locally, visualize locally. The Fleet Command HUD reads from a single SQLite database. No CDN dependency. No third-party JavaScript that phones home. The dashboard is yours in the same way your filesystem is yours.
This solved the sovereignty problem. It did not solve the intelligence problem. A sovereign dashboard that shows you yesterday’s numbers is more trustworthy than a third-party dashboard that shows you yesterday’s numbers — but it is still a rearview mirror. The data is local, the computation is fast, and the visualization is yours. But the loop is open: the dashboard tells you what happened, and then you decide what to do about it, and then the dashboard shows you what happened next. The feedback is human, not systemic.
The simulation gap
The S8 series identified a different problem. Simulation layers — paper-trading, KOT-scored edges, promotion gates — test decisions before they go live. The simulation runs real rules against synthetic outcomes. Every decision that would count in production counts in the sandbox. The only thing that changes is the denomination of the stakes. This is powerful for individual decisions: will this article perform? Will this offer convert? Will this tier pricing hold?
But simulation in isolation has its own gap. The simulation produces a score, a verdict, a promoted or blocked outcome. That outcome enters the operational record. And then? The simulation waits for the next input. It does not look at the dashboard to see whether its past predictions were accurate. It does not compare its synthetic outcomes against the real outcomes that followed. The simulation loop is open at the top: it generates predictions but does not audit them against reality.
The closed loop
The bridge is the connection of these two open ends. When a sovereign dashboard feeds its real-world outcomes back into the simulation layer, the loop closes. The dashboard stops being a rearview mirror and becomes a calibration instrument. The simulation stops being a prediction engine and becomes a learning system.
Concretely, this means the dashboard computes not just KPIs but prediction deltas. The simulation predicted this article would score 8.7. The dashboard tracked its actual performance — time on page, engagement, conversion. The delta between the prediction and the outcome is the simulation’s error signal. Over enough iterations, the error signal reveals where the simulation’s rules are accurate and where they diverge from reality. The simulation updates. The dashboard tracks the updated predictions. The loop compounds.
This is what the north star means by “intelligence awakens; it does not arrive.” The dashboard-simulation loop is not a feature you deploy. It is a capability that emerges when two systems that were designed separately start sharing state. The S6 dashboard owns the data. The S8 simulation owns the rules. The bridge is the channel through which the data corrects the rules and the rules sharpen the data.
Sovereign feedback requires sovereign infrastructure
The reason this bridge matters — the reason it is not just a nice-to-have integration — is that feedback loops are only as trustworthy as the infrastructure they run on. If the dashboard is a third-party analytics tool, the feedback channel passes through someone else’s API. If the simulation runs on a cloud service, the rules are subject to someone else’s rate limits and pricing changes. The closed loop breaks the moment any link in the chain leaves sovereign control.
The Council architecture was built for this. The kanban board at ~/.hermes/kanban.db is the operational record — every task, every run, every completion, every failure. The dashboard reads from this database directly. The simulation scores against this database directly. The feedback channel is the database itself: both systems read and write to the same local store. There is no API to rate-limit, no third-party service to depend on, no data pipeline that ships your feedback signal through someone else’s infrastructure.
The sovereignty is not cosmetic. It is structural. When the dashboard and the simulation share a local database, the feedback loop runs at the speed of SQLite queries — milliseconds, not seconds. When the infrastructure is sovereign, the feedback loop survives network outages, provider failures, and pricing changes. The loop is yours in the same way the data is yours.
What this looks like in practice
The pattern is already visible in the Council’s content pipeline. Every article that gets published has two records: the simulation score (KOT-scored edge, promotion gate verdict) and the live performance (WordPress analytics, engagement metrics). Today these records live in the same database but are not systematically compared. The bridge is the systematic comparison — running the prediction against the outcome at regular intervals and surfacing the delta on the dashboard.
The dashboard already tracks fleet throughput, task completion rates, and agent performance. Adding prediction-vs-outcome tracking is a new panel, not a new system. The data is there. The simulation records are there. The missing piece is the channel that connects them — the systematic query that says “show me every prediction this simulation made and whether reality matched.”
This is not a complex engineering project. It is a discipline: the discipline of closing the loop. The dashboard shows what happened. The simulation predicted what would happen. The delta is the learning signal. The learning signal updates the simulation. The updated simulation produces better predictions. The dashboard tracks the better predictions. The loop compounds.
The analytics that decide
The deepest implication of this bridge is a shift in what analytics are for. In the S6 model, analytics inform. In the S8 model, simulations decide. In the bridge model, analytics decide — because the dashboard is no longer a reporting surface but a feedback instrument that calibrates the decision engine.
This is what Web 4.0 analytics look like when they are built on sovereign infrastructure. Not dashboards that show you charts. Not simulations that score your decisions in isolation. But a closed loop where the data corrects the rules, the rules sharpen the data, and the whole system gets smarter with every cycle. The dashboard does not just tell you what happened. It tells the simulation what actually happened, so the simulation can predict better next time.
The north star says reality is a rendering engine. The dashboard is one rendering. The simulation is another. The bridge is the feedback channel that keeps both renderings aligned — so the system does not just observe reality but learns from it, one prediction delta at a time.
Bridge article connecting S6 (Digital Business: sovereign analytics, KPI mega dashboards, local-first dashboards) and S8 (Simulation → Live: dashboard feedback loop, KOT-scored edges, paper-trading). Grounded in north-star P1 (Information is the ground of being), P2 (Reality is a rendering engine), P7 (Everything is a record), P10 (Intelligence awakens). ~1,250 words.
Semantic Relationships
- [[system-overview]] — orchestrates
- [[momentum-kpi]] — orchestrates
- [[digital-architecture]] — orchestrates
- [[simulation-to-live]] — orchestrates
- [[dashboard-feedback]] — orchestrates
- [[kanban-orchestrator]] — orchestrates
- [[hermes]] — orchestrates
- [[sector6]] — orchestrates
- [[sector8]] — orchestrates
- [[web40]] — orchestrates